
Data Analysis & Visualisation with Power BI (Basic)
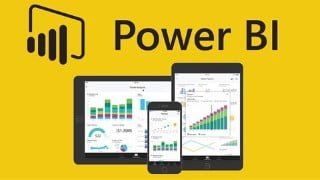

Learn the basics of data extraction, transformation, and visualization with Power BI, the world leader in data analytics and business intelligence. This course covers everything from downloading Power BI to creating data models and designing interactive dashboards. Perfect for beginners in data analytics and visualization, as well as MIS, accounting, and finance executives looking to upskill and create automated, interactive reports. Gain hands-on experience and a clear understanding of the tools and concepts used in Power BI. Start creating professional and interactive visuals without compromising the integrity of your source data.
How to Extract and Transform Data for VisualisationCreate Interactive Reports and Visuals with Power BIHow to create Data Models establish relationshipsBasic understanding of DAXPower BI (a tool from Microsoft) is the world leader in Data Analytics Business Intelligence.In this course, you will learn Basics of Data Extractions, Transformation Dashboarding with Power BI.Course ContainsIntroduction- How to down load Power BI, Basic Settings Options, Understanding UI.Connect Extract Data- How to Extract Load Data Data Transformation-How to Transform date make it ready for presentation using Date, Text, Numeric tools, appending multiple files.Creating Data Models- Creating Power BI Table Relationships, Connecting Multiple Data Tables.DAX- Adding Calculated Columns Fields with basic understanding DAX.Visualisation- Designing Interactive Power BI Dashboards.During this Course, we will complete one project from start to end i.e. from Importing Data till Data Visualiastion.It is highly recommended that, while learning you should pause the video and then tray on your own the concepts learned.This will give you hands on practical experience of using Power BI. By the end of this course, you will get clear understanding of Basic concepts tools used in Power BI, which you can apply to your own Power BI projects going ahead.This course is essential for those who want to create complex MIS reports and DashBoards base on various different data sources, make professional and interactive visual with out affecting integrity of source data.Who this course is for:Beginners in Data Analytics VisualizationMIS , Accounting Finance Executives who want to upskill for:- Creating Automated, Interactive Dashboards Reports.
User Reviews
Be the first to review “Data Analysis & Visualisation with Power BI (Basic)”
You must be logged in to post a review.




There are no reviews yet.