
Data Exploration | Data Analysis | Data Visualization
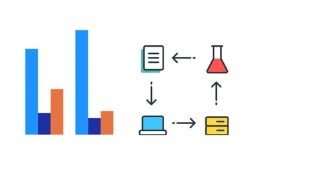

Discover the power of data exploration and analysis with our course. Perfect for beginner data analysts and scientists. Start today!
Connect to data sourceExplore Tabular DataExplore Pandas Data FrameManipulate Pandas Data FramePerform data cleaningCreate visualizationData exploration is the initial step in data analysis, where users explore a large data set in an unstructured way to uncover initial patterns, characteristics, and points of interest. This process isn’t meant to reveal every bit of information a dataset holds, but rather to help create a broad picture of important trends and major points to study in greater detail. Data exploration can use a combination of manual methods and automated tools such as data visualizations, charts, and initial reports.Exploratory Data Analysis (EDA) is the first step in your data analysis process. Here, you make sense of the data you have and then figure out what questions you want to ask and how to frame them, as well as how best to manipulate your available data sources to get the answers you need. You do this by taking a broad look at patterns, trends, outliers, unexpected results and so on in your existing data, using visual and quantitative methods to get a sense of the story this tells. You’re looking for clues that suggest your logical next steps, questions or areas of research.Data analysis is a process of inspecting, cleansing, transforming, and modelling data with the goal of discovering useful information, informing conclusions, and supporting decision-making.Data visualization is the presentation of data in a pictorial or graphical format. It enables decision makers to see analytics presented visually, so they can grasp difficult concepts or identify new patterns.Who this course is for:Beginner Data AnalystBeginner Data Scientist
User Reviews
Be the first to review “Data Exploration | Data Analysis | Data Visualization”
You must be logged in to post a review.





There are no reviews yet.