Order Flow Trading

Learn how to make accurate trading decisions using order flow imbalance charts. Identify supply and demand zones and institutional trading levels. Perfect for experienced traders.
What you’ll learn
- Order Flow Trading
- Imbalance footprint
- Foot print chart
- Day trading with orderflow
- institutional trading supply and demand zone
- price action trading
- Intraday
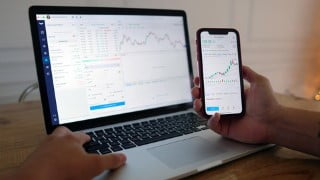
Order Flow foot print chart will bring you the real time data with most accurate volume so we make decision where exactly bank and institutional trades has been done how to trade with them.
Don’t simply follow Price action see what exactly happened behind the candle by applying imbalance candles
By combining order flow imbalance foot print chart with lower time normal candlestick we can make very sharp entry and very tight stop loss
Rather than simply taking those on price action and hitting your stop loss you may loose faith in trading so why to risk our hard money on the low winning strategy.
Imbalance in footprint chart highlights the price levels where a buy trade volume is excess over a sell trade volume. Diagonal Bid/Ask imbalance displays aggressive buy market orders lifting the offer and aggressive sell market orders hitting the bid.
Stacked Imbalances shows zones of multiple consecutive imbalances that occur on bid or ask side. These zones are important support/resistance levels because they are levels where participants aggressively wanted to get into the market. So when the market retests those levels, the same participants may appear again.
So, by combining these most advance charting tool we can take accurate decision
Who this course is for:
- For those trader who want to learn supply and demand based on order flow imbalance chart
- Experience traders to identify bank or institutional zones


There are no reviews yet.