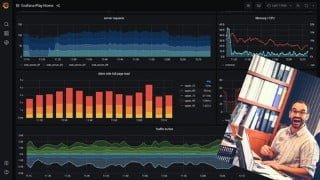
Grafana Beginners to Advance Crash Course 2021
Learn the latest version of Grafana, its architecture, installation on Linux/Windows/Docker, creating dashboards, and more. Perfect for data scientists and BI professionals.
What you’ll learn
- Grafana Introduction
- Grafana Overview and Overall Architecture
- Installing Grafana on a Linux Server
- Installing Grafana on Windows
- Starting, Stopping Grafana Services on Windows
- Installing Grafana on Docker
- Creating Grafana Dashboards
- Grafana User Interface Overview
- Installing and Managing InfluxDB Services
- Installing and Managing Telegraf Services
- Grafana Dashboard – Server Health Summary Dashboard
- Graph Panel – CPU & Memory Utilization
- Graph Panel – Multiple Servers & Problem Statement to use Grafana Variables
- Custom Variable – Static Variable Values
- Query Variable – Dynamic Variable Values
- Dependent Varialbes – Cascaded Variables
- Automatic Repeat Panel Based on Variable Value
- Organizing Panels and Dashboards for Easy Management
- Repeat Row to Create Dynamic Grafana “Summary Dashboard”
- Fixing Y Axis’ Minimum and Maximum Value in Graph Panel
- Creating Thresholds in Graph Visualizations
- Python Program to Increase Memory Utilization for Testing Purpose
- Creating Thresholds in Graph Visualization and StatsD Graphs
- Advance Tabular Visualization With Gauge in one column
- Advance Stat Visualization in Grafana 7
- Exploring More Visualization Properties – Legends, Axis, Series Override
- Creating Grafana Dashboard Using MySQL As Data Source
- Using Custom SQL Query to Create Dashboard
- Monitoring Websites and Docker Services
- Monitoring Websites or URL Using Grafana
- Monitor Docker Services
- Installing Plugins
- Installing Plugins and Creating Pie Chart Visualization
- Creating Alerts and Annotation in Dashboards in Grafana
- Grafana Email Alerts Configuration
- Grafana and Telegram Integration and Alerts Configuration
- Users and Roles Creation and Management in Grafana
- User and Roles Creation in Grafana
- Embedding Grafana Panel on Any Website
- Embedding Grafana Panel in any HTML Page (Website)
- Upgrading Grafana From Version 6 to Version 7 (Latest Version)
- Upgrade Grafana From Version 6 to Version 7
- Changing Grafana Database to MySQL
Show moreShow less
In this course you’re going to learn about Latest Version of Grafana which is released in March 2021. This is also the latest version currently available in the market.
We will discuss in detail on below topics:
Grafana Introduction
Grafana Overview and Overall Architecture
Installing Grafana on a Linux Server
Installing Grafana on Windows
Starting, Stopping Grafana Services on Windows
Installing Grafana on Docker
Creating Grafana Dashboards
Grafana User Interface Overview
Installing and Managing InfluxDB Services
Installing and Managing Telegraf Services
Grafana Dashboard – Server Health Summary Dashboard
Graph Panel – CPU & Memory Utilization
Graph Panel – Multiple Servers & Problem Statement to use Grafana Variables
Custom Variable – Static Variable Values
Query Variable – Dynamic Variable Values
Dependent Varialbes – Cascaded Variables
Automatic Repeat Panel Based on Variable Value
Organizing Panels and Dashboards for Easy Management
Repeat Row to Create Dynamic Grafana “Summary Dashboard”
Fixing Y Axis’ Minimum and Maximum Value in Graph Panel
Creating Thresholds in Graph Visualizations
Python Program to Increase Memory Utilization for Testing Purpose
Creating Thresholds in Graph Visualization and StatsD Graphs
Advance Tabular Visualization With Gauge in one column
Advance Stat Visualization in Grafana 7
Exploring More Visualization Properties – Legends, Axis, Series Override
Creating Grafana Dashboard Using MySQL As Data Source
Using Custom SQL Query to Create Dashboard
Monitoring Websites and Docker Services
Monitoring Websites or URL Using Grafana
Monitor Docker Services
Installing Plugins
Installing Plugins and Creating Pie Chart Visualization
Creating Alerts and Annotation in Dashboards in Grafana
Grafana Email Alerts Configuration
Grafana and Telegram Integration and Alerts Configuration
Users and Roles Creation and Management in Grafana
User and Roles Creation in Grafana
Embedding Grafana Panel on Any Website
Embedding Grafana Panel in any HTML Page (Website)
Upgrading Grafana From Version 6 to Version 7 (Latest Version)
Optional – Upgrade Grafana From Version 6 to Version 7
Optional – Changing Grafana Database to MySQL
I am more than happy to create more detailed video on certain topics based on the requests coming from students. If you need more clarity on any of the topic please do write to me and I will be more than happy to create more detailed video on certain topics based on the requests coming from students.
Who this course is for:
- Data Scientists
- Business Intelligence Analysts
- Business Intelligence Developers
User Reviews
Be the first to review “Grafana Beginners to Advance Crash Course 2021”
You must be logged in to post a review.


There are no reviews yet.