
Introduction to Data Visualization with ggplot2
| Course Details | ||||||||
|---|---|---|---|---|---|---|---|---|
|
||||||||
| Languages | ||||||||
|
||||||||
| Outcomes | ||||||||
|
||||||||
| Price & Terms | ||||||||
|
||||||||
| Technical | ||||||||
|
||||||||
| Specification | ||||||||
|
||||||||
Build scatter, bar and line plots in R with ggplot2, map data to color and size, fix overplotting, and style charts with themes.
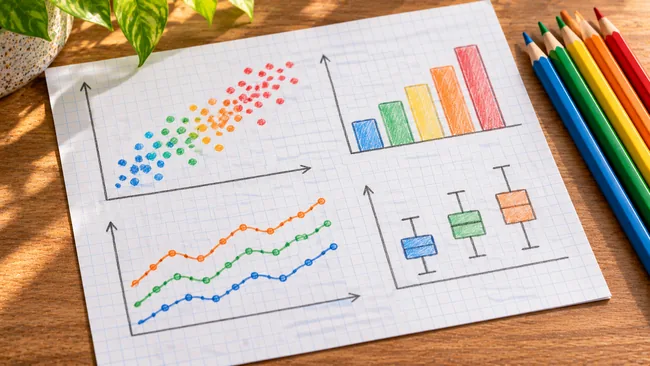
Plotting data in R with the ggplot2 package rests on the grammar of graphics, which builds a chart from separate layers. The challenge is turning continuous and categorical columns into visual scales a reader can take in at a glance, while keeping the audience in mind. You map variables to color, shape and size, choose a geometry that suits the data, deal with points that overlap, and finish by styling the chart so it is ready for publication.
What You Will Achieve
- Map data columns to color, fill, shape and size, and tell a mapping apart from a fixed attribute in your code
- Reduce overplotting in scatter plots with jittering, transparency and careful shape choices
- Draw histograms, bar plots and line plots, and control how bars and bins are positioned
- Adjust legends, whitespace and built-in themes to turn an exploratory chart into an explanatory one
Program Overview
Grammar of Graphics and Aesthetic Mappings
Begins with an audience-first mindset and the layers of a ggplot2 plot, then turns data columns into visual scales.
- Exploratory versus explanatory plots
- ggplot2 layers and adding geometries
- Color, fill, shape, size and alpha
- Mappings versus fixed attributes and their conflicts
Geometries for Common Plot Types
Builds scatter plots, histograms, bar plots and line plots, with several ways to construct each one.
- Overplotting with large, aligned, low-precision and integer data
- Bin and bar positions
- Sequential color palettes for bar plots
- Multiple time series
Themes and Publication-Quality Plots
Styles the finished chart and shapes it to explain a point clearly to readers.
- Legend position and whitespace
- Built-in themes and ggthemes
- Explanatory plots built with geoms
- Embellishments with annotate()
Certificate Awarded (Paid)
Complete the course to earn it.
Job Outlook
These plotting skills apply wherever data insights have to be communicated visually, including data science work and analysis roles in finance, marketing and business.
Good for: R learners who want a layer-by-layer method for building scatter, bar and line charts with ggplot2 and styling them for readers.
Keep in mind: It is the first course of a series, and the extra grammar of graphics layers that add more variables to a plot are left for the next course.
Bottom line: Steady practice on mappings, overplotting and themes gives a solid grounding in how ggplot2 assembles a chart.
Frequently Asked Questions
What separates an aesthetic from an attribute in ggplot2?
An aesthetic maps a data column onto a visual scale such as color or size, so it changes with the data, while an attribute fixes that property at one value. The lessons also show what happens when the two conflict.
Does the course cover every layer of the grammar of graphics?
No. It works with the data, aesthetics, geometries and themes layers. The next course in the series adds further layers for showing more variables in a plot.
Do the course videos come with transcripts?
Yes. Each video has a live transcript you can reveal from the bottom left of the player, and a course glossary sits in the resources section alongside the lessons.


There are no reviews yet.