
Statistical Thinking in Python (Part 2)
| Course Details | ||||||||
|---|---|---|---|---|---|---|---|---|
|
||||||||
| Languages | ||||||||
|
||||||||
| Outcomes | ||||||||
|
||||||||
| Price & Terms | ||||||||
|
||||||||
| Technical | ||||||||
|
||||||||
| Specification | ||||||||
|
||||||||
Estimate parameters, build bootstrap confidence intervals and run permutation hypothesis tests in Python, ending with a case study on Darwin’s finches.
Statistical inference in this course comes down to two tasks: estimating the parameters of a distribution that describes a data set, and judging how plausible the observed data would be if a given model were true. You work through both with simulation-based hacker statistics in Python, using optimization, resampling and permutation on real measurements that include baseball no-hitters, rainfall records, literacy and fertility rates, and the beaks of Darwin’s finches.
What You Will Achieve
- Find the parameter values that best describe a data set and fit a straight line by least squares
- Resample a data set to put confidence intervals on a mean, a rate or a regression
- Set up a null hypothesis, simulate it and compute a p-value with permutation or bootstrap methods
- Check data with exploratory plots and ECDFs before fitting a model or running a test
Program Overview
Parameter Estimation by Optimization and Bootstrapping
Finding the parameters that best describe data, then using resampling to show how far those estimates could vary.
- Optimal parameters and least-squares linear regression
- Exploratory analysis and Anscombe’s quartet
- Bootstrap replicates, the SEM and confidence intervals
- Pairs bootstrap on literacy and fertility data
Hypothesis Testing with Permutation and Bootstrap Tests
Building and simulating a null hypothesis, computing p-values, then practicing on A/B tests and correlation.
- Permutation samples, test statistics and p-values
- One- and two-sample bootstrap hypothesis tests
- A/B testing with the 1964 Civil Rights Act vote
- Correlation tests and neonicotinoid effects on bees
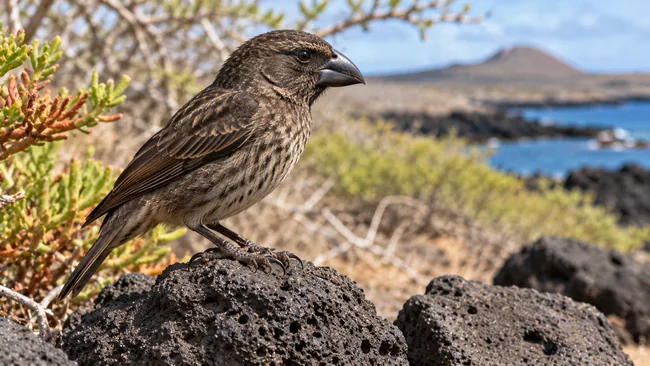
Case Study: Darwin’s Finches on Daphne Major
Applying estimation and testing to Peter and Rosemary Grant’s finch measurements to see evolution in the data.
- Beak depth ECDFs and parameter estimates
- Testing whether beaks were deeper in 2012
- Beak shape regressions and length-to-depth ratio
- Heritability from offspring and parental data
Certificate Awarded (Paid)
Job Outlook
Estimating parameters, building confidence intervals and testing hypotheses by simulation are used in data analysis, in judging A/B tests, and in research that draws conclusions from measured data.
Good for: Learners who want to practice parameter estimation and hypothesis testing in Python by simulation, on data sets with a real story behind them.
Keep in mind: This is the second part of a series, and its intervals and tests are all built by resampling and simulation in Python code.
Bottom line: A practice-heavy course in hacker statistics that closes on the Grants’ finch data from Daphne Major, where estimation and testing reveal evolution at work.
Frequently Asked Questions
What is bootstrapping in statistical inference?
Bootstrapping uses only the data you actually have to approximate what you would learn by repeating the data collection an endless number of times. The course has you generate bootstrap replicates by hand and in code, then turn many of them into confidence intervals.
Which real data sets do the exercises use?
The exercises draw on baseball no-hitters, rainfall records, literacy and fertility rates, Anscombe's quartet, frog data, the 1964 Civil Rights Act vote, a time-on-website example, bee sperm counts linked to neonicotinoid insecticides, and finch beak measurements.
What makes a hypothesis test tricky to set up?
Three choices have to be made with care: what the null hypothesis is, how to simulate it, and what counts as more extreme than the observed result when computing the p-value. A full chapter of worked examples gives practice on exactly these choices.
Where does the finch data in the final case study come from?
Peter and Rosemary Grant have gathered measurements of Darwin's finches on the Galápagos island of Daphne Major for more than 40 years. The case study uses their data to estimate beak parameters, test changes over time and measure how heritable beak depth is.
User Reviews
Write your review
You must be logged in to post a review.
Reviews can only be posted by registered learners. Log in or create a free account, then you will return here to post.


There are no reviews yet.