
Power Bi – Master Power Bi with 40+ hours of Premium Content
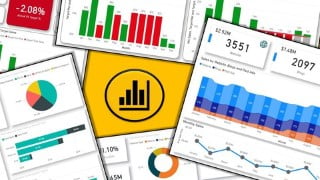

Learn how to create dynamic reports and interactive dashboards using Power BI. Analyze data from multiple sources, transform raw data into beautiful visualizations, and gain meaningful insights. Master Power BI Desktop and its components, including Power Query and DAX. Showcase your skills with two full-scale course projects. Access your results from multiple devices using Power BI Mobile. Stay updated with the latest versions of Power BI. This course is perfect for anyone interested in data analysis and visualization using a business intelligence tool like Power BI. Start learning today!
We have covered real life 151 data modelling scenarios using Power Query, DAX and Data VisualizationYou will learn to create 5 interactive multipage dashboards. Create and transform raw data into beautiful interactive dashboards using Power Query, DAX.Master Data Analysis Expressions (DAX) and Power Query (M Language) for Power BI DesktopLearn how to analyze data from multiple sources, create your individual datasets based on these sources and transform your results into interactive reportsUnderstand Power BI Desktop and its components. Understand the end to end business intelligence workflowHow to Create, Transform and build Relationships between different tablesHow to Build and Refine Data Models using Custom Formulas and How to work in the different views of the Data ModelHow to create a report with different interactive visualization typesShowcase your skills with two full scale course projectsAt the end of this course students will be able to analyze data from different data sources and create their own datasetsLearn the required knowledge to dive deeper into Power BI applicationsHow to access your results from multiple devices using Power BI MobileHands On Experience using a Business Intelligence tool like Power BIContent gets updated each time a new versions of Power BI is releasedShow moreShow lessMaster Power BI Desktop learn advanced Power BI analysis data visualizationThis course will provide you the skillset you need to create Dynamic Reports and Interactive Dashboards to analyze and interpret meaningful insights from your any data using a Business Intelligence tool like Microsoft Power BI. We have created content with relevance to real world scenariosFrom this course, you will learn how to analyze data based on relevance using Power BI.Power BI is a business analytics and business intelligence service by Microsoft. It aims to provide interactive visualizations and business intelligence capabilities with an interface simple enough for end users to create their own reports and dashboards. Power BI is part of the Microsoft Power Platform.Power BI is a collection of software services, apps, and connectors that work together to turn your data from different sources into visually immersive and insightful reports.Using Power BI Desktop, you can create rich, interactive reports with visual analytics at your fingertips for free. It can connect to more than 65 on-premises and cloud data sources to turn information into interactive visuals. Data scientists and developers work with Power BI Desktop to produce reports and make them available to the Power BI service.In Power BI Desktop, users can:Connect to raw data from different sourcesExtract, Profile, Clean, Transform and model the data. Build a Relational Data Model using Power Query and DAXBuild and optimize data models and DAX measuresCreate charts and graphs using different visualization techniquesDesign and create reports and interactive dashboards to get meaningful insightsAnalyze hidden trends and patternsCreate and manage datasetsShare reports with others using the Power BI service within or outside the organizationIn this course, You will learn data analysis and data visualization using Power Query, M Language, Dax and Visualizations in Power BI. You will learn about Power BI Desktop and its components. Learn how to use the Power Query Editor to connect Power BI to various data sources, learn how to work on the Data Models to get meaningful insights.You will learn how to work with hierarchies and timeseries to find trends in your data and make accurate forecasts. We will go from basic to advanced in a step by step process. Each section provides a new data set and exercises that will challenge you so you can learn by immediately applying what you’re learning.Topics you will Learn We will cover 151 Power BI Data Modelling Real Life examplesWe will cover 5 Multipage Interactive Dashboard projectsYou will learn Power BI in a Step by Step ProcessLearn how to use Power BI Desktop and Power BI Query Editor Learn how to create relationships between related data sources in Power BILearn to create Power BI Data Models using the Power Query, M Language and DAX Formula language to create powerful calculationsLearn Power BI DAX and how to use it to build custom MeasuresUse the built in Power BI QA feature to easily ask questions regarding your data to get new meaningful insightLearn to create Power BI reports with various types of aggregations and filtersLearn to create Powerful Interactive reports and dashboards with drill throughs and relative date filters in Microsoft Power BICreate a wide range of Power BI Charts, Graphs and Visualizations using drag and drop methods from Data Visualization ToolsLearn how to use themes and custom visualizations in enhance your reportsBy the time you complete this course, you’ll be a highly proficient Power BI user.So what are you waiting for?Let’s get started.Who this course is for:There is no One Stop Solutions to learn everything. In this course, we’ve focused on providing you with the fundamentals you need to work with Power BI effectivelyAnyone who is interested to learn Data Analysis Data Visualizations using Business Intelligence tool like Power BIInterested to build visualizations, reports interactive dashboards with Power BI DesktopLearn how to convert raw data Into compelling data visualizations using Power BIIf you are interested in Story Telling based on any available Data
User Reviews
Be the first to review “Power Bi – Master Power Bi with 40+ hours of Premium Content”
You must be logged in to post a review.





There are no reviews yet.