
Working with Geospatial Data in Python
| Course Details | ||||||||
|---|---|---|---|---|---|---|---|---|
|
||||||||
| Languages | ||||||||
|
||||||||
| Outcomes | ||||||||
|
||||||||
| Price & Terms | ||||||||
|
||||||||
| Technical | ||||||||
|
||||||||
| Specification | ||||||||
|
||||||||
Read, map and join spatial data in Python with GeoPandas, handle coordinate reference systems, and apply it to a mining sites case study.
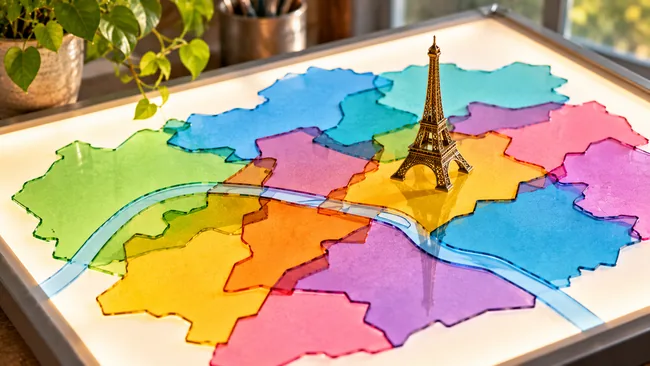
With GeoPandas, point and polygon geometries become part of ordinary pandas work in Python. Many datasets, such as census counts or shop listings, carry a location that can be put to work. You read files in GeoJSON, shapefile and geopackage formats, draw them as maps, and connect separate sources through where their records sit. You then see why coordinate reference systems matter when you reshape geometries for new uses.
What You Will Achieve
- Read GeoJSON, shapefile and geopackage files into Python and turn them into maps of a city
- Find which district holds a given landmark and how far away the nearest restaurant is
- Combine two datasets by location and shade districts by a computed density
- Convert layers to a shared projection and check which mining sites sit inside national parks
Program Overview
Geospatial Vector Data with GeoPandas
Covers what vector data is and how GeoPandas represents it, using Paris districts and restaurant locations for first explorations and plots.
- Vector data concepts and the GeoDataFrame
- Exploring Paris districts and restaurants
- Population density maps and groupby summaries
- Layered plots with a background map
Spatial Relationships and Choropleth Maps
Explains how geometries relate in space, how to query and join data on those relationships, and how classification choices shape a choropleth.
- Shapely points and spatial methods
- Spatial joins of districts and bike stations
- Tree density by district
- Equal interval and quantile classification
Coordinate Reference Systems, Overlay and a Mining Sites Case Study
Shows how a CRS defines coordinates and how to reproject them, builds new geometries through intersection and overlay, then applies it all to Eastern Congo.
- Geographic versus projected coordinates and Web Mercator tiles
- Intersections and overlay of land use polygons
- Buffers and custom per-geometry operations
- A first look at raster layers
Certificate Awarded (Paid)
Job Outlook
Location-based analysis in Python supports data science work wherever records carry coordinates, including city data on districts, trees and bike stations, land use studies, and mapping of mining sites near protected areas.
Good for: Analysts working in Python who hold data with a location attached and want to query, join and map it by place.
Keep in mind: The course centers on vector data, mostly from Paris datasets; raster data appears only as a brief preview in the final chapter.
Bottom line: Steady GeoPandas practice on Paris city data ends in a case study on Eastern Congo mining sites that adds buffers and custom operations.
Frequently Asked Questions
Which Python library does the course rely on?
GeoPandas is the main library, extending pandas so tables can hold geometries. Shapely geometries also appear when you create points and test how shapes relate to one another.
Which places do the exercise datasets cover?
Most exercises work with Paris datasets on districts, restaurants, bike stations, trees and land use. The final chapter switches to artisanal mining sites in Eastern Congo and nearby national parks.
How much raster data is included?
Raster data gets a short section at the end, where you import and plot a raster layer and extract information from it. Every earlier chapter works with vector data.
Which choropleth classification methods are compared?
The lessons build a map of tree density by district, then contrast equal interval and quantile classification to show how the chosen algorithm changes what a choropleth suggests.
User Reviews
Write your review
You must be logged in to post a review.
Reviews can only be posted by registered learners. Log in or create a free account, then you will return here to post.


There are no reviews yet.